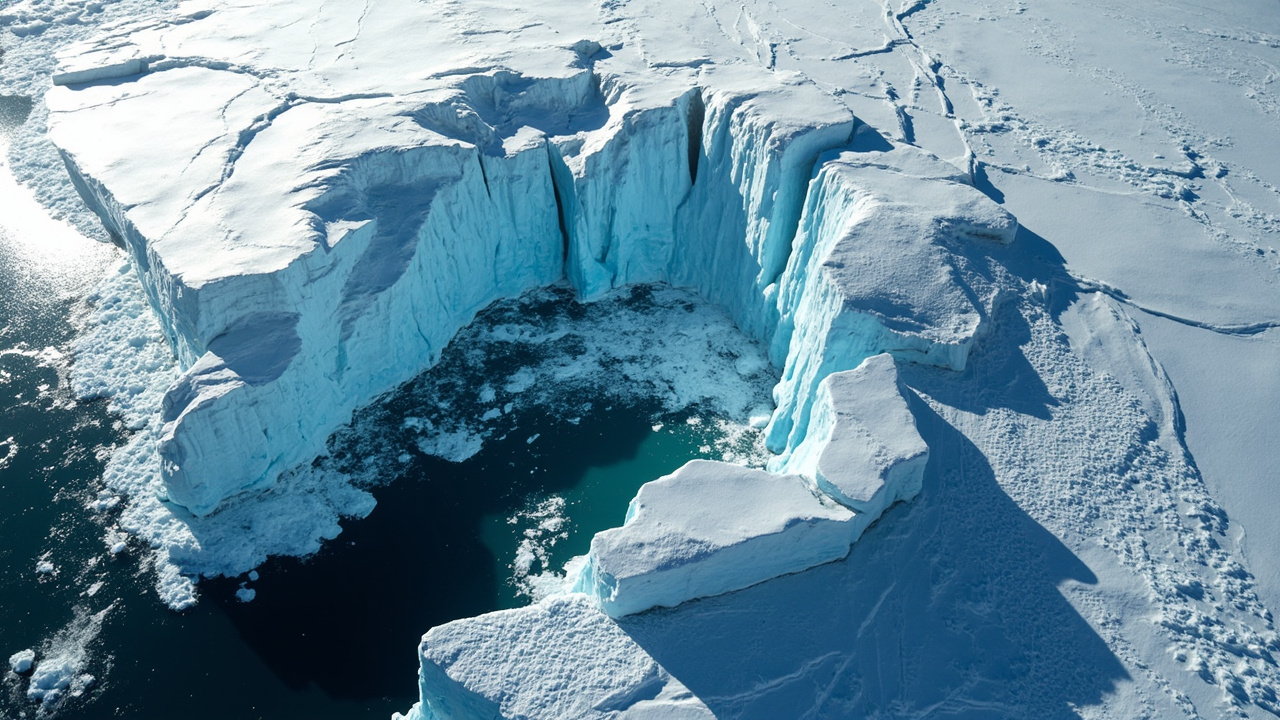
TL;DR: Greenland and Antarctica shed 11.3 trillion tonnes of ice between 1979 and 2023, lifting global seas 3.14 centimeters, with 84% of the loss driven by faster glacier flow into the ocean.
A half-century satellite synthesis published September 16, 2026, delivers the most continuous measurement yet of polar ice change. The work, from the Ice Sheet Mass Balance Intercomparison Exercise (IMBIE), merges 42 separate ice assessments built from 27 orbiting missions, extending coverage to 1972 for Greenland and 1979 for Antarctica, according to the European Space Agency.
The central result is stark in scale. The two ice sheets together released 11,309 billion tonnes of ice during 1979-2023, a value reported in the journal Scientific Data. That transfer of frozen water to the sea added 31.4 millimeters, or 3.14 centimeters, to the worldwide ocean level. Greenland supplied the larger portion at 1.81 centimeters, while Antarctica supplied 1.33 centimeters, according to the European Space Agency.
A record built from 27 satellites
IMBIE was created to reconcile unlike space observations into one coherent climate history. Support comes from the European Space Agency and the U.S. National Aeronautics and Space Administration, with scientific leadership from Inès Otosaka and Andrew Shepherd at Northumbria University and Tyler Sutterley at the University of Washington Applied Physics Laboratory, according to Northumbria University.
The difficulty lies in method diversity. Spacecraft do not observe frozen mass one identical way. Some carry altimeters that track shifts in surface elevation. Others sense variations in Earth's gravity field. Radar and optical imagers follow the motion of outlet glaciers. Sensor design, ground resolution and retrieval approaches have also evolved over five decades, according to the European Space Agency.
To manage those differences, investigators compared separate mass-balance products — the arithmetic between ice accumulation and ice removal — and adjusted for contrasts in technique, instrument and study interval. That reconciliation separates authentic ice-sheet evolution from artifacts introduced by changing observation systems, according to the European Space Agency.
Early Landsat imagery proved especially important for lengthening the series. Although steady, repeating coverage of the ice sheets started only in 1979, the first Landsat spacecraft obtained isolated velocity observations over Greenland after its 1972 launch. Estimation across gaps in that pioneering material allowed the Greenland chronology to reach back to 1972, according to New Scientist.
Contributing missions include ESA's CryoSat, the Copernicus Sentinel fleet, the U.S.-German Gravity Recovery and Climate Experiment missions and the Landsat series, according to the European Space Agency. The resulting compilation is described as the longest satellite chronology of ice-sheet transformation assembled to date.
Speeding flow, not surface thaw, dominates
The assessment partitions total change into two broad mechanisms: dynamical imbalance, meaning accelerated discharge of glacial ice toward the sea, and surface mass balance, involving snowfall gain minus surface melting and related atmospheric exchanges. Regional climate simulations assisted that separation, according to Scientific Data.
Dynamical imbalance accounts for 84% of combined wastage, leaving 16% tied to surface processes. In practical terms, more than four-fifths of the missing ice was carried oceanward by quickening glaciers rather than liquefied in place on the ice surface, according to the European Space Agency.
Lead author Inès Otosaka said the extended timeline reveals that extended behavior is tied to warming seas acting on glacier motion.
That distinction matters for technology and prediction. Surface melting responds comparatively directly to air temperature and summer conditions. Glacier acceleration involves ocean heat reaching ice fronts, reduced buttressing, lubrication at the bed and shifting resistance as termini retreat. Those ocean-ice interactions can behave nonlinearly, making them harder to represent in numerical forecasts, according to New Scientist.
The Antarctic picture illustrates the point. The southern continent is sufficiently cold that surface liquefaction is essentially absent as a net contributor. All of its net deficit stems from ocean-forced melting and quickening of outlet glaciers, according to the European Space Agency. Greenland experiences both influences, including pronounced summer melt episodes, yet discharge still dominates the combined half-century total.
An independent specialist not involved in leading the work, Michael Meredith at the British Antarctic Survey, told New Scientist that a greater ocean-driven share raises concern because ocean-ice feedbacks may generate rapid, disproportionate reactions.
From near balance to hundreds of billions of tonnes yearly
In the 1970s, Greenland hovered near equilibrium, with accumulation roughly matching export. By the 1980s, its yearly deficit averaged approximately 60 billion tonnes. During the 2010s, that yearly deficit reached 264 billion tonnes, a period punctuated by repeated severe summer melt occurrences, according to the European Space Agency.
Antarctica traced a parallel acceleration. Its yearly deficit increased from approximately 48 billion tonnes in the 1980s to 202 billion tonnes in the 2010s. West Antarctica registered rising ice export in every decade of the space chronology, propelled especially by Pine Island and Thwaites Glaciers, according to the European Space Agency.
Across both sheets, the pace of wastage quickened sharply beginning in the 1990s. Researchers calculate that the rate of loss grew by roughly a factor of four since the 1980s, according to New Scientist. To visualize the cumulative volume, New Scientist described the 11.3-trillion-tonne deficit as comparable to a frozen cube 23 kilometers tall.
Together, the two sheets now account for approximately one-quarter of worldwide sea-level increase, according to the European Space Agency. Their behavior also dominates projection spread. High-end worldwide sea-level estimates for 2150 grow by a factor of 2.6 when instability mechanisms within ice sheets enter the calculation, according to Northumbria University.
The human exposure linked to the measured change is disproportionate to its centimeter scale. IMBIE founder Andrew Shepherd said a little more than three centimeters places an additional six to nine million people in danger from shoreline inundation and erosion.
Why 2020-2023 looked different
The latest segment, covering 2020 through 2023, shows a temporary easing in the pace of net wastage. Over East Antarctica, unusually abundant snowfall supplied enough added mass to counterbalance a portion of glacier losses in other sectors. Over Greenland, a sequence of comparatively cool summers curtailed surface melting substantially, cutting that component by roughly one-half, according to the European Space Agency.
Investigators emphasize that the pause does not signify recovery. Both ice masses remained in overall deficit. Annual swings in snowfall, air temperature and glacier motion can obscure the persistent downward trajectory for a few years without altering it, according to the European Space Agency.
Northumbria University similarly characterized the recent pattern as transient variability against an unambiguous extended decline rather than a change in direction. Such variability is expected when atmospheric conditions fluctuate year to year, even while ocean heat continues to act on vulnerable glacier termini.
What the measurement enables next
The practical value of the dataset is its use as a check on models. Satellites supply continent-spanning, year-by-year evidence of present behavior. That observational anchor lets modelers test representations of flow, snowfall, meltwater runoff, firn compaction and glacial isostatic adjustment — the slow rebound of solid Earth beneath changing ice loads described in Scientific Data.
IMBIE co-lead Tyler Sutterley said the extended duration, broader team participation and stronger uncertainty treatment make this the most dependable ice-sheet balance evaluation completed so far, according to Northumbria University.
Continuity of observation is therefore a central message. Diego Fernández, head of ESA's Science Section, said the outcomes demonstrate why spacecraft monitoring must continue and why long ice-sheet climate archives need maintenance, pointing to CryoSat-2 and the Sentinels as examples, according to Northumbria University. Reuters also highlighted the September 16 findings, noting satellite coverage reaching back to the 1970s, a 1979-2023 deficit of 11.3 trillion tons and a 1.24-inch ocean contribution from an international polar team.
For coastal planning, the implication is that ocean-driven glacier dynamics deserve as much attention as atmospheric warming. If unstable retreat mechanisms such as marine ice-sheet instability and marine ice-cliff instability operate more forcefully than presently parameterized, future Antarctic losses could exceed presently anticipated intervals, according to New Scientist. Maintaining calibrated, multi-sensor surveillance offers the clearest path to detecting such shifts early and narrowing uncertainty around coming sea-level rise.
Sources referenced
- ESA - Faster-flowing glaciers fuel decades of polar ice loss (https://www.esa.int/Applications/Observing_the_Earth/FutureEO/Faster-flowing_glaciers_fuel_decades_of_polar_ice_loss)
- Mass balance of the Greenland and Antarctic ice sheets from the 1970s to 2023 | Scientific Data (https://www.nature.com/articles/s41597-026-08088-0)